Two Consumers, One EconomySeptember 29, 2026 Kara Murphy Key Takeaways:
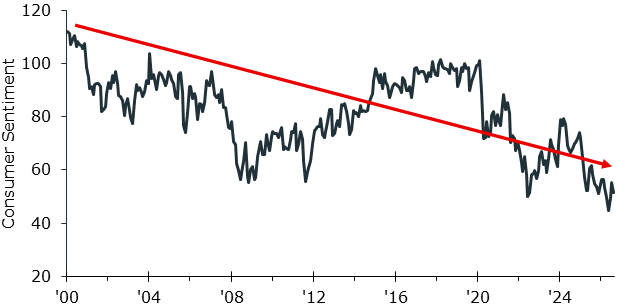
You've probably seen the “split this into 4 payments” button pop up at checkout for a new pair of shoes or a laptop. Now people are increasingly using it for something more basic: groceries. A recent survey found 29% of buy-now-pay-later users have financed a grocery run this way, more than double the share from just two years ago. People are paying for pasta and produce in installments. At the same time, surveys show consumers growing more uneasy about the economy. Concerns about the cost of living, higher food and energy prices continue to weigh on household confidence. If sentiment is any guide, you’d expect consumers to be pulling back. Instead, spending remains surprisingly strong. How can consumers be increasingly worried while continuing to spend? The answer is that there isn’t just one American consumer, there are effectively two. One group is benefiting from rising asset values and growing wealth, while the other is increasingly relying on wages and credit to maintain spending. Understanding that divide can help explain why consumer sentiment and consumer spending have moved in opposite directions. Consumers Feel Worse than Their Spending SuggestsConsumer sentiment has historically been a useful gauge of future spending behavior. When households become worried about finances or inflation, spending often slows soon afterward. The University of Michigan’s Consumer Sentiment Index remains well below long-term averages, reflecting the ongoing concerns about affordability and cost-of-living pressures.
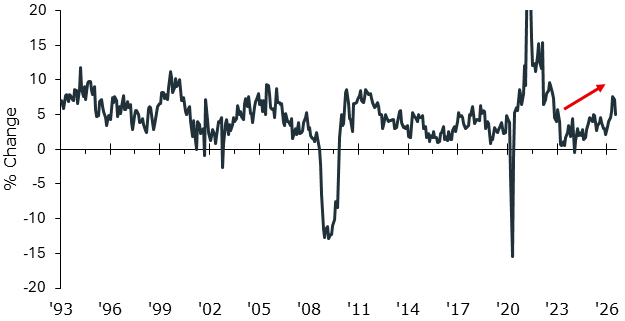
University of Michigan Consumer Sentiment: January 2000 – August 2026 Source: Kestra Investment Management with data from FRED. Data as of 09/28/2026. Yet spending data paints a different picture. Retail sales increased 6.0% year-over-year in August, while the three-month trend accelerated to 6.3%, one of the strongest readings in recent years. Travel demand remains healthy, service spending continues to expand, and many discretionary categories have been surprisingly resilient. U.S. Retail Sales, Year over Year: January 1993 – August 2026
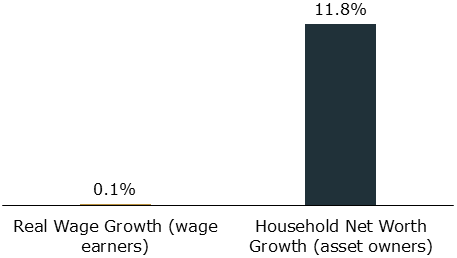
Source: Kestra Investment Management with data from the U.S. Census Bureau. Data as of 09/28/2026. Two Different Economies are Funding Two Different Kinds of SpendingHousehold net worth reached a record $195.9 trillion in Q2 2026, supported by rising stock and real estate values. Economists call this the “wealth effect”: rising asset prices encourage consumers to spend more, even before gains are realized. Every dollar of stock market gains adds a few cents a year to spending. This wealth effect has helped drive premium retail and travel sales. The catch: the top 10% of Americans hold roughly two-thirds of household wealth, meaning that only a small number of households benefit from the wealth effect. Most households depend primarily on wages, which have barely kept pace with inflation. Average pay has risen roughly 3.5% over the past year while prices have increased about 3.4%, leaving little improvement in purchasing power. Growth in Real Wages and Household Net Worth: August 2025 – August 2026
Source: Kestra Investment Management with data from USAFacts (BLS data), Federal Reserve Z.1. Data as of 09/28/2026 Evidence of that strain is beginning to show. For example, McDonald’s recently reported weaker U.S. traffic trends and directly tied this decline to the pressures lower-income households are currently facing. The result is a widening divide between households benefiting from the wealth effect and those still constrained by day-to-day affordability pressures. Why Spending is Financed Rather than FundedCredit metrics also point to some consumer stress. The personal savings rate has fallen from 8.6% in mid-2021 to 3.0% today, while credit card balances have climbed to $1.26 trillion, near record high levels. Meanwhile, the 90-day delinquency rate has eased slightly to 12.8%, near the highest level in more than a decade. Even as credit has weakened somewhat, household debt relative to disposable income remains well below pre-financial-crisis levels, and aggregate household balance sheets remain healthy. What This Means for the EconomyConsumer indicators hide a growing divide. Some households are benefiting from rising asset values and spending accordingly, while others are working harder just to keep up with higher costs. For investors, that distinction matters. Consumer spending may remain resilient even as confidence stays subdued, but economic strength will depend less on how consumers feel and more on what is happening in labor markets, household balance sheets, and asset prices. Invest wisely and live richly, Kara The opinions expressed in this commentary are those of the author and may not necessarily reflect those held by Kestra Advisor Services Holdings C, Inc., d/b/a Kestra Holdings, and its subsidiaries, including, but not limited to, Kestra Advisory Services, LLC, Kestra Investment Services, LLC, Kestra Private Wealth Services, and Bluespring Wealth Partners, LLC. The material is for informational purposes only. It represents an assessment of the market environment at a specific point in time and is not intended to be a forecast of future events, or a guarantee of future results. It is not guaranteed by any entity for accuracy, does not purport to be complete and is not intended to be used as a primary basis for investment decisions. It should also not be construed as advice meeting the particular investment needs of any investor. Neither the information presented nor any opinion expressed constitutes a solicitation for the purchase or sale of any security. This material was created to provide accurate and reliable information on the subjects covered but should not be regarded as a complete analysis of these subjects. It is not intended to provide specific legal, tax or other professional advice. The services of an appropriate professional should be sought regarding your individual situation. Kestra Advisor Services Holdings C, Inc., d/b/a Kestra Holdings, and its subsidiaries, including, but not limited to, Kestra Advisory Services, LLC, Kestra Investment Services, LLC, Kestra Private Wealth Services, and Bluespring Wealth Partners, LLC, do not offer tax or legal advice. |
Markets in a Minute - Two Consumers, One Economy